Key takeaways:
-
Stablecoin inflow patterns mirror levels seen after the LUNA and FTX collapse. Pointing to fresh accumulation and the potential for a breakout rally.
-
Bitcoin holds above $100,000, but new user activity is still low, indicating a “HODL” phase where holders are waiting for fresh demand to drive prices higher.
Bitcoin (BTC) is flashing early signs of a strong rally, but the price chart is not drawing attention. Onchain data shows a “demand generation” pattern similar to the accumulation phases seen after the Terra/LUNA and FTX collapse, and both marked major cycle bottoms.
Bitcoin researcher Axel Adler Jr. said that the 30-day moving average of stablecoin inflows has dipped into negative territory, forming the same “blue zones” previously seen in 2022. This suggests participants are not ready to sell, signaling a return of meaningful demand amid suppressed volatility. Adler said,
“If inflows remain at or surpass levels seen post-LUNA and FTX, it would strongly signal the launchpad of the next Bitcoin rally.”
Bitcoin network activity signals HODL dominance
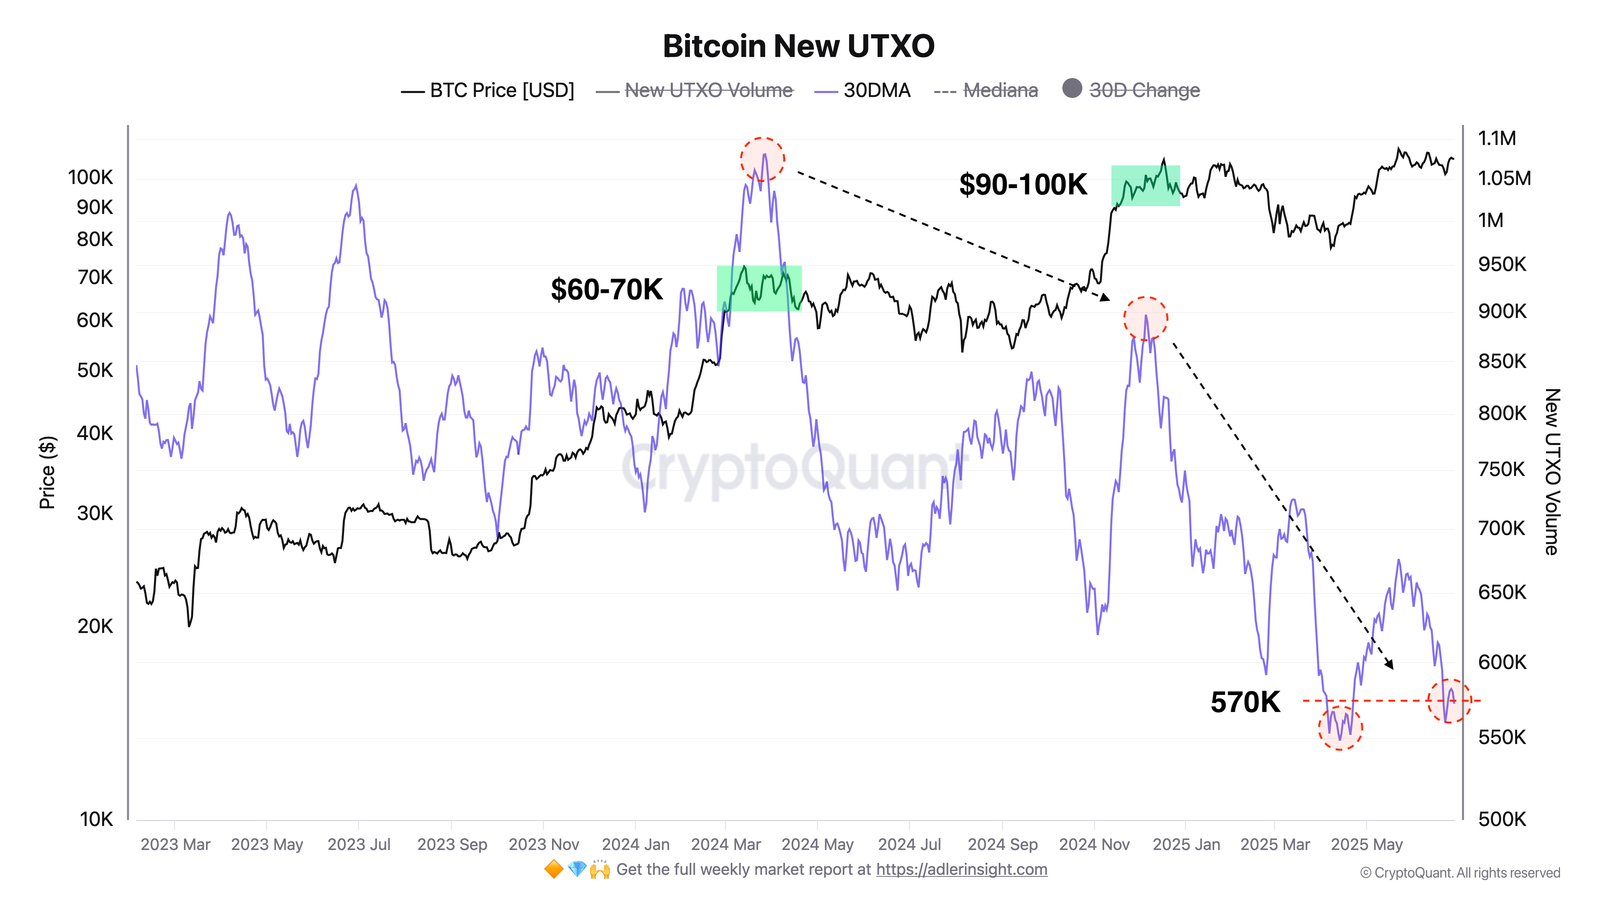
BTC price is strong above $100,000, but the New UTXO 30-day SMA, a proxy for new network activity, remains near 570,000. That’s roughly 40% lower activity than when BTC was trading between $60,000–$70,000 and far from the 850,000–1 million range that supported the 2024 bull run.
This divergence suggests that long-term holders are locking up coins, not moving them, creating a supply squeeze scenario where price could rapidly rise if new demand kicks in. A move past 700,000 on the New UTXO metric would signal that fresh participants are entering. If it climbs beyond 850,000, it could confirm the start of a full-blown retail and institutional-driven bull phase.
The Exchange Flow Multiple supports this setup, tracking short-term to long-term BTC inflows, which has dropped to a zone that historically marks a seller exhaustion phase where diminished sell-side liquidity sparks upside price momentum.
Meanwhile, whales appear to be mobilizing. Large transactions now comprise 96% of all exchange flows, a level historically associated with major price expansions. These entities may position coins for strategic redistribution, often timed with price spikes.
Related: Record Q2, monthly close next? 5 things to know in Bitcoin this week
BTC risk in demand-supply imbalance persists
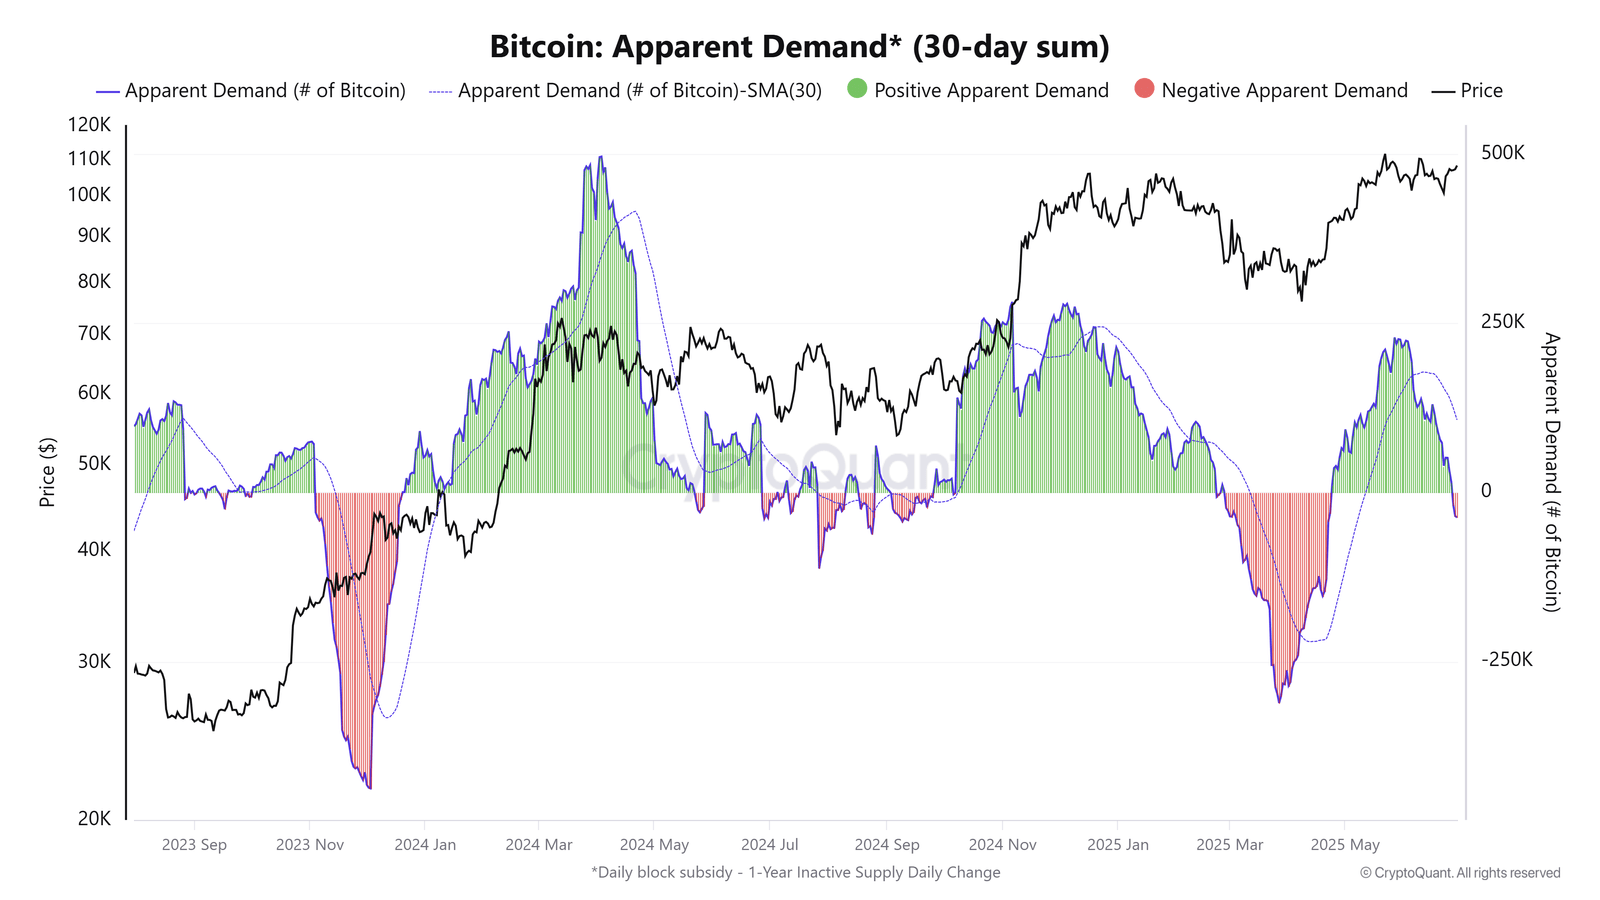
Despite these bullish structural signals, short-term risks remain. The Apparent Demand metric for 30 days has returned negative for the first time in two months, indicating that new buyer demand isn’t strong enough to absorb selling pressure from miners and some long-term holders (LTHs). This imbalance raises the risk of a near-term price correction.
In this mixed environment characterized by HODLing, seller exhaustion, and early whale activity, Bitcoin’s next move hinges on whether fresh demand can outpace residual selling. A short-term correction could precede the broader uptrend if momentum stalls near key resistance levels at $110,000.
Related: Bitcoin’s new all-time high now ‘inevitable’ as BTC price eyes liquidity at $109K
This article does not contain investment advice or recommendations. Every investment and trading move involves risk, and readers should conduct their own research when making a decision.