Key takeaways:
-
Bitcoin’s Bollinger Bands indicator now sees the potential for BTC price breakout above $110,000.
-
Bitcoin eyes new all-time highs in July due to multiple tailwinds.
Bitcoin (BTC) could see further upside volatility as BTC’s price holds key levels, according to a classic technical analysis metric.
Bollinger Bands: BTC price nears breakout
In a Sunday post on X, crypto YouTuber Crypto Rover said that Bitcoin was positioned for an upward breakout based on Bollinger Bands analysis.
Bollinger Bands, a Bitcoin indicator used by traders to assess momentum and volatility within a certain range, had reached its tightest point in 12 months, signaling that a significant price move may be underway or imminent.
Crypto Rover shared a chart showing that Bitcoin Bollinger Bands were “tighter than they’ve been” since February 2024 across three-day timeframes.
Related: ‘False move’ to $105K? 5 Things to know in Bitcoin this week
Bitcoin surged about 75% between February and March of 2024 to its previous all-time highs of $74,000, after breaking above the upper boundary of the Bollinger Bands.
If history repeats, Bitcoin’s current price of $108,900 could quickly turn into a new all-time high of $190,000, according to data from Cointelegraph Markets Pro and TradingView.
In an accompanying comment, Crypto Rover said:
“Big pump incoming!”
He wasn’t the only trader to spot the emerging pattern.
“Bollinger band tighter than it’s been for over a year,” said crypto analyst Cantonese Cat, adding, “Bigger move coming.”
“The $BTC Bollinger Bands are pretty compressed — currently around yearly lows at a 9.4% price range,” wrote Crypto markets commentator Frank Fetter in an X post.
The $BTC Bollinger Bands are pretty compressed — currently around yearly lows at a 9.4% price range. When vol? pic.twitter.com/H69SWOZD9x
— Frank (@FrankAFetter) June 30, 2025
John Bollinger, the creator of the Bollinger Bands volatility indicator, had previously said that Bitcoin’s multiple rejections from the upper boundary of the indicator around $110,000 could mark a local top.
But the indicator’s creator is now bullish once again. In a Sunday post on X, Bollinger said:
“Bitcoin looks to be setting up for an upside breakout.”
Multiple metrics: Bitcoin “bull trend is intact”
As Cointelegraph continues to report, multiple factors are putting Bitcoin in a good position for more upside despite hitting resistance at $110,000.
In addition to persistent institutional demand through spot Bitcoin ETFs and treasury companies, BTC’s giant cup-and-handle pattern in higher timeframes projects a breakout to as high as $230,000.
Looming US tariff deadlines along with an upcoming “Crypto Week” in Washington D.C. could unlock risk appetite among the bulls.
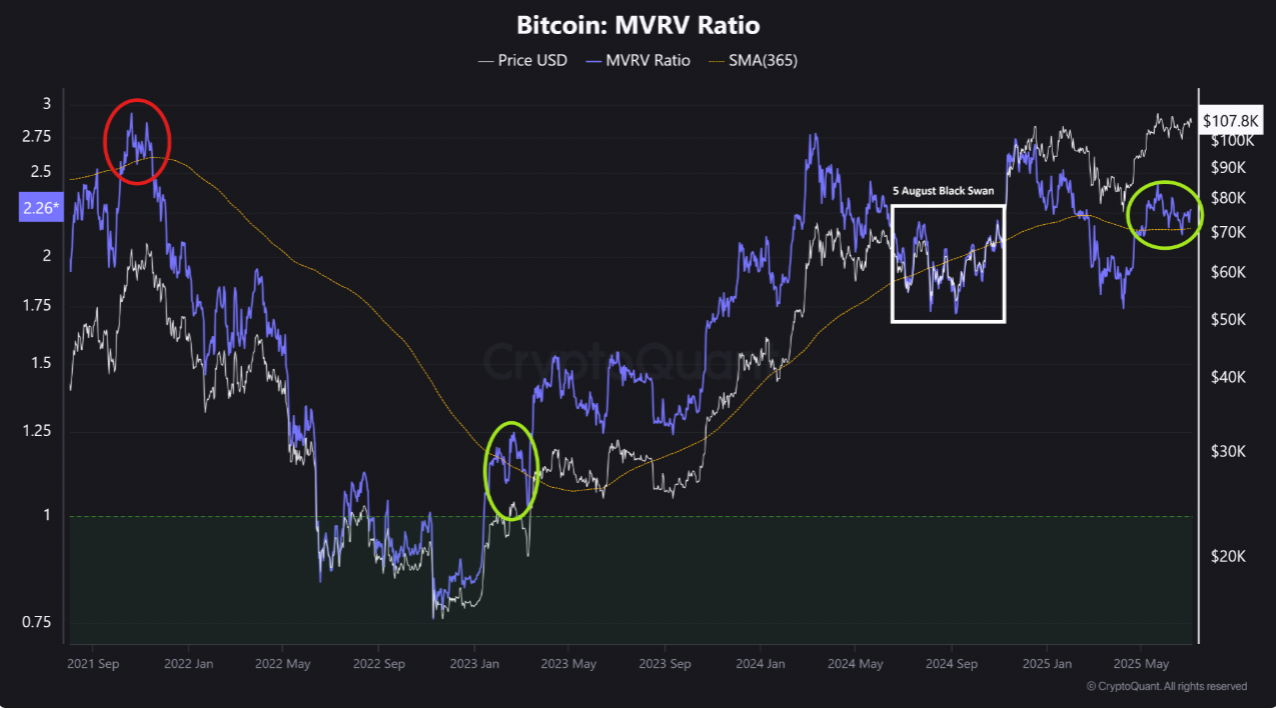
Meanwhile, the Bitcoin market value realized value “MVRV” ratio, an onchain metric used to assess whether Bitcoin’s price is overvalued or undervalued, is at 2.23, above its 365-day simple moving average (SMA365) at 2.15, per data from CryptoQuant.
“Historically, as long as MVRV stays above its SMA365, the uptrend tends to continue,” explained CryptoQuant analyst Burakkesmeci in a QuickTake analysis, adding:
“The bull trend is intact.”
As Cointelegraph reported, continued expansion of global money supply (M2) serves as another potential catalyst for Bitcoin to reach $170,000 in the coming months.
This article does not contain investment advice or recommendations. Every investment and trading move involves risk, and readers should conduct their own research when making a decision.